Android性能怎么优化,都有哪些优化工具
Admin发表于 2022-05-07 17:21:41735 次浏览
 在实际案例的操作过程中,我们可能会遇到“Android性能怎么优化,都有哪些优化工具”这样的问题,那么我们该如何处理和解决这样的情况呢?这篇小编就给大家总结了一些方法,具有一定的借鉴价值,希望对大家有所帮助,接下来就让小编带领大家一起了解看看吧。
 性能优化的帮助工具:
MAT,Memory Monitor(属于AndroidMonitor中一个模块),HeapTool(查看堆信息),Allaction Tracking,LeakCanaryLint工具
1.Allaction Tracking
(1)追踪

在内存图中点击途中箭头的部分,启动追踪,再次点击就是停止追踪,随后自动生成一个alloc结尾的文件,这个文件就记录了这次追踪到的所有数据,然后会在右上角打开一个窗口。展示和第一种方式有点区别,各有所长,他有两种展现方式。
(2)分类我们的内存分配
红框中:
Group by Method:用方法来分类我们的内存分配,默认会以Group by Method来组织
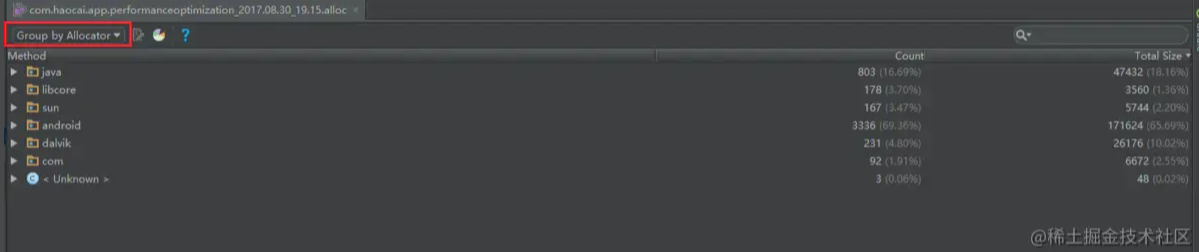
Group by Allocator:用内存分配器来分类我们的内存分配
我们用 Group by Allocator的方式来查看一下:
可以看到我们自己包中,每一个类的内存分配次数和分配的大小。如果我们想看内存分配的实际在源码中发生的地方,可以选择需要跳转的对象,点击该按钮就能发现我们的源码。
(3)查看统计图
想看某个图层详细内存分配,则双击速表左键进入下一图层:
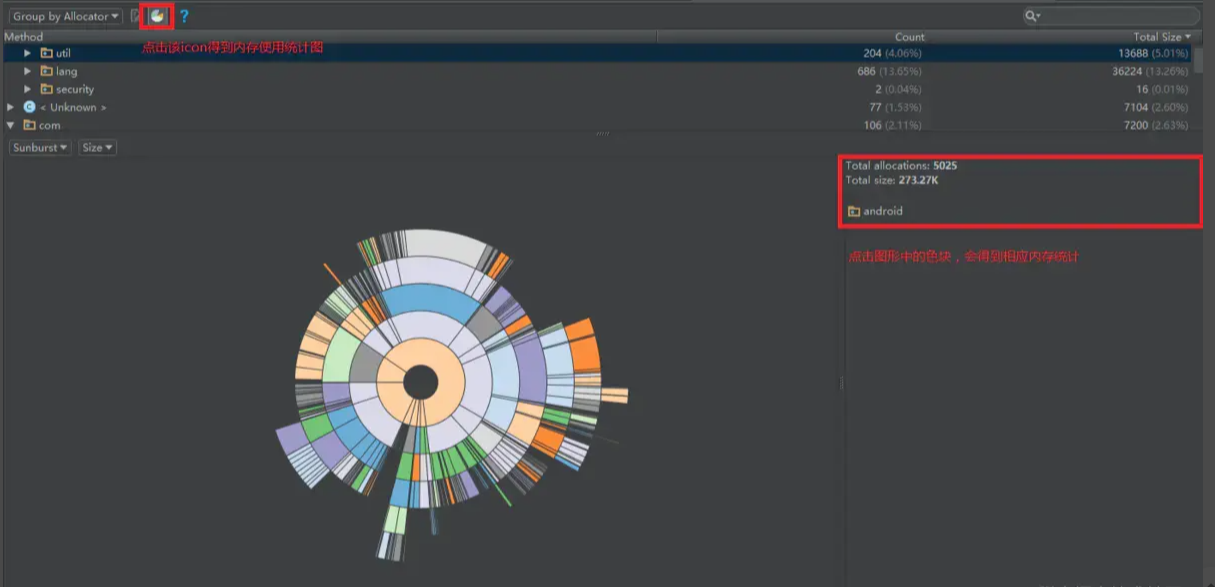
内存分配情况
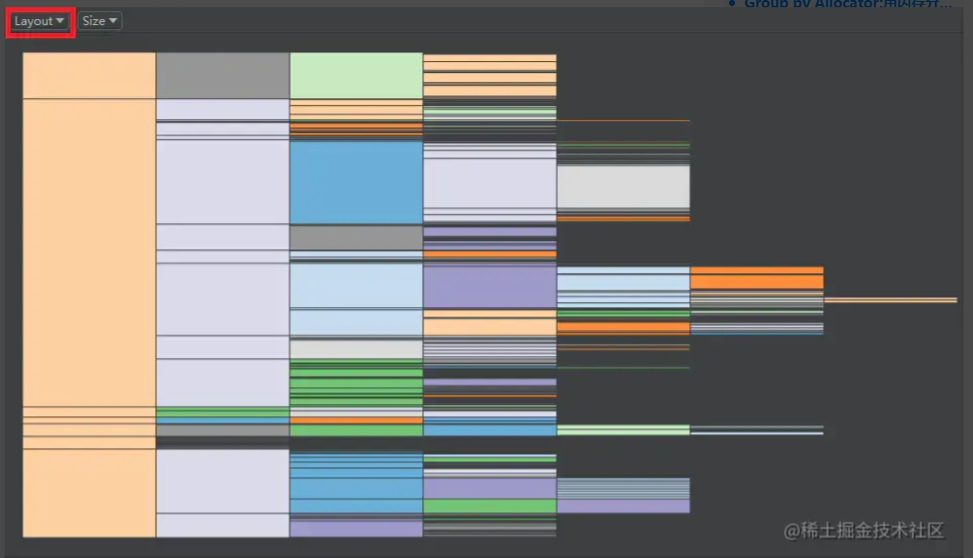
通过[Layout方式查看更直观:
2.LeakCanary
(1)配置
Getting started

In your build.gradle:

 dependencies {

   debugCompile 'com.squareup.leakcanary:leakcanary-android:1.5.2'

   releaseCompile 'com.squareup.leakcanary:leakcanary-android-no-op:1.5.2'

 }

In your Application class:

public class ExampleApplication extends Application {

  @Override public void onCreate() {

    super.onCreate();

    if (LeakCanary.isInAnalyzerProcess(this)) {

      // This process is dedicated to LeakCanary for heap analysis.

      // You should not init your app in this process.

      return;

    }

    LeakCanary.install(this);

    // Normal app init code...

  }

}
(2)制造一个单例内存泄漏的点
public class CommonUtils {

    private static CommonUtils instance;

    private Context context;

    private CommonUtils(Context context) {

        this.context = context;

    }

    public static CommonUtils getInstance(Context context) {

        if (instance == null) {

            instance = new CommonUtils(context);

        }

        return instance;

    }

}

 protected void onCreate(Bundle savedInstanceState) {

        super.onCreate(savedInstanceState);

        setContentView(R.layout.activity_main);

        CommonUtils commonUtils = CommonUtils.getInstance(this);

    }
(3)LeakCanary 发出内存泄漏通知
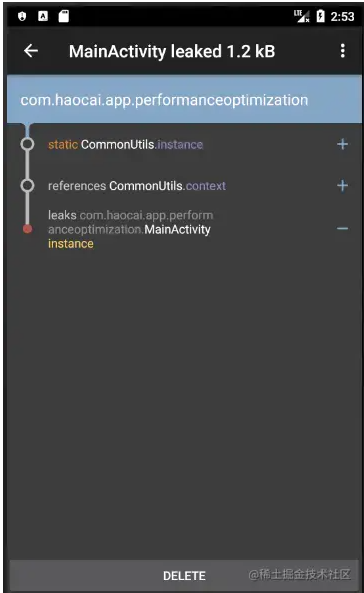
(4)LeakCanary 分析
LeakCanary 本质上还是用命令控制生成hprof文件分析检查内存泄漏。
3.Lint分析工具
Android Studio很方便,很好用,你可以试试点击AS菜单栏上面的Analyze选项,然后点击Inspection Scope,然后选择你需要检测的范围(比如整个项目),然后AS会自动弹出下图所示的面板
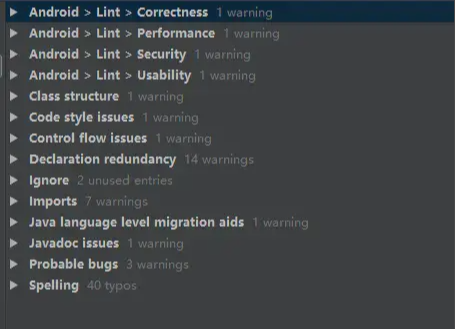

可能出现内存泄漏的类:
检测资源文件是否有没有用到的资源。
检测常见内存泄露
安全问题SDK版本安全问题
是否有费的代码没有用到
代码的规范---甚至驼峰命名法也会检测
自动生成的罗列出来
没用的导包
可能的bug
以上就是关于“Android性能怎么优化,都有哪些优化工具”的相关知识,感谢各位的阅读,想要掌握这篇文章的知识点还需要大家自己动手实践使用过才能领会,如果想了解更多相关内容的文章,欢迎关注群英网络,小编每天都会为大家更新不同的知识。
免责声明:本站发布的内容(图片、视频和文字)以原创、转载和分享为主,文章观点不代表本网站立场,如果涉及侵权请联系站长邮箱:mmqy2019@163.com进行举报,并提供相关证据,查实之后,将立刻删除涉嫌侵权内容。
标签:
Android性能优化
相关信息推荐
2021-12-23 19:13:05
2022-11-19 17:51:06
2022-09-26 18:00:13

2022-12-14 11:21:38
2022-08-19 17:53:01
2022-08-19 17:51:59
Android性能优化
物流仓库配送
PHP填充数组
无界AI
Lombok
Go语言处理json数据
CommonJS模块规范
Spring事务
我的世界服务器
php安装grpc扩展
es模块执行
url中文传参乱码
url的参数转数组
Python判断集合
java获取字符串长度
redis的scan
mysql时间差
if-else的嵌套
c语言进制转换
表格插件
c语言字符串定义
Java几何图形绘制
mysql collate
oracle修改时区
linux系统
laravel清除缓存
stdafx.h
Go泛型
php修改数据库编码
空格转换nbsp符
2022-02-25 17:19:26
2022-01-24 19:23:44
2022-01-04 18:53:44
2022-01-26 18:39:38
2021-11-20 17:46:01
2022-01-18 18:00:09
2022-01-13 18:58:11
2022-01-24 19:23:57
2021-11-22 17:53:55
2021-11-20 17:45:40

群英网络助力开启安全的云计算之旅


Copyright © QY Network Company Ltd. All Rights Reserved. 2003-2019 群英网络 版权所有 茂名市群英网络有限公司
增值电信经营许可证 : B1.B2-20140078 粤ICP备09006778号


